

SmartReporting.io
Smart Reporting enables you to create reports on:
- Number of leads created per month per sales rep
- Conversion rate per acquisition source per month this year
- Conversion rate per Pipeline stage
- and so much more
What you’ll need
- A Smart Reporting Account
- A Close account and your API Key
Setup
- Go to https://smartreporting.io/ and create your FREE account
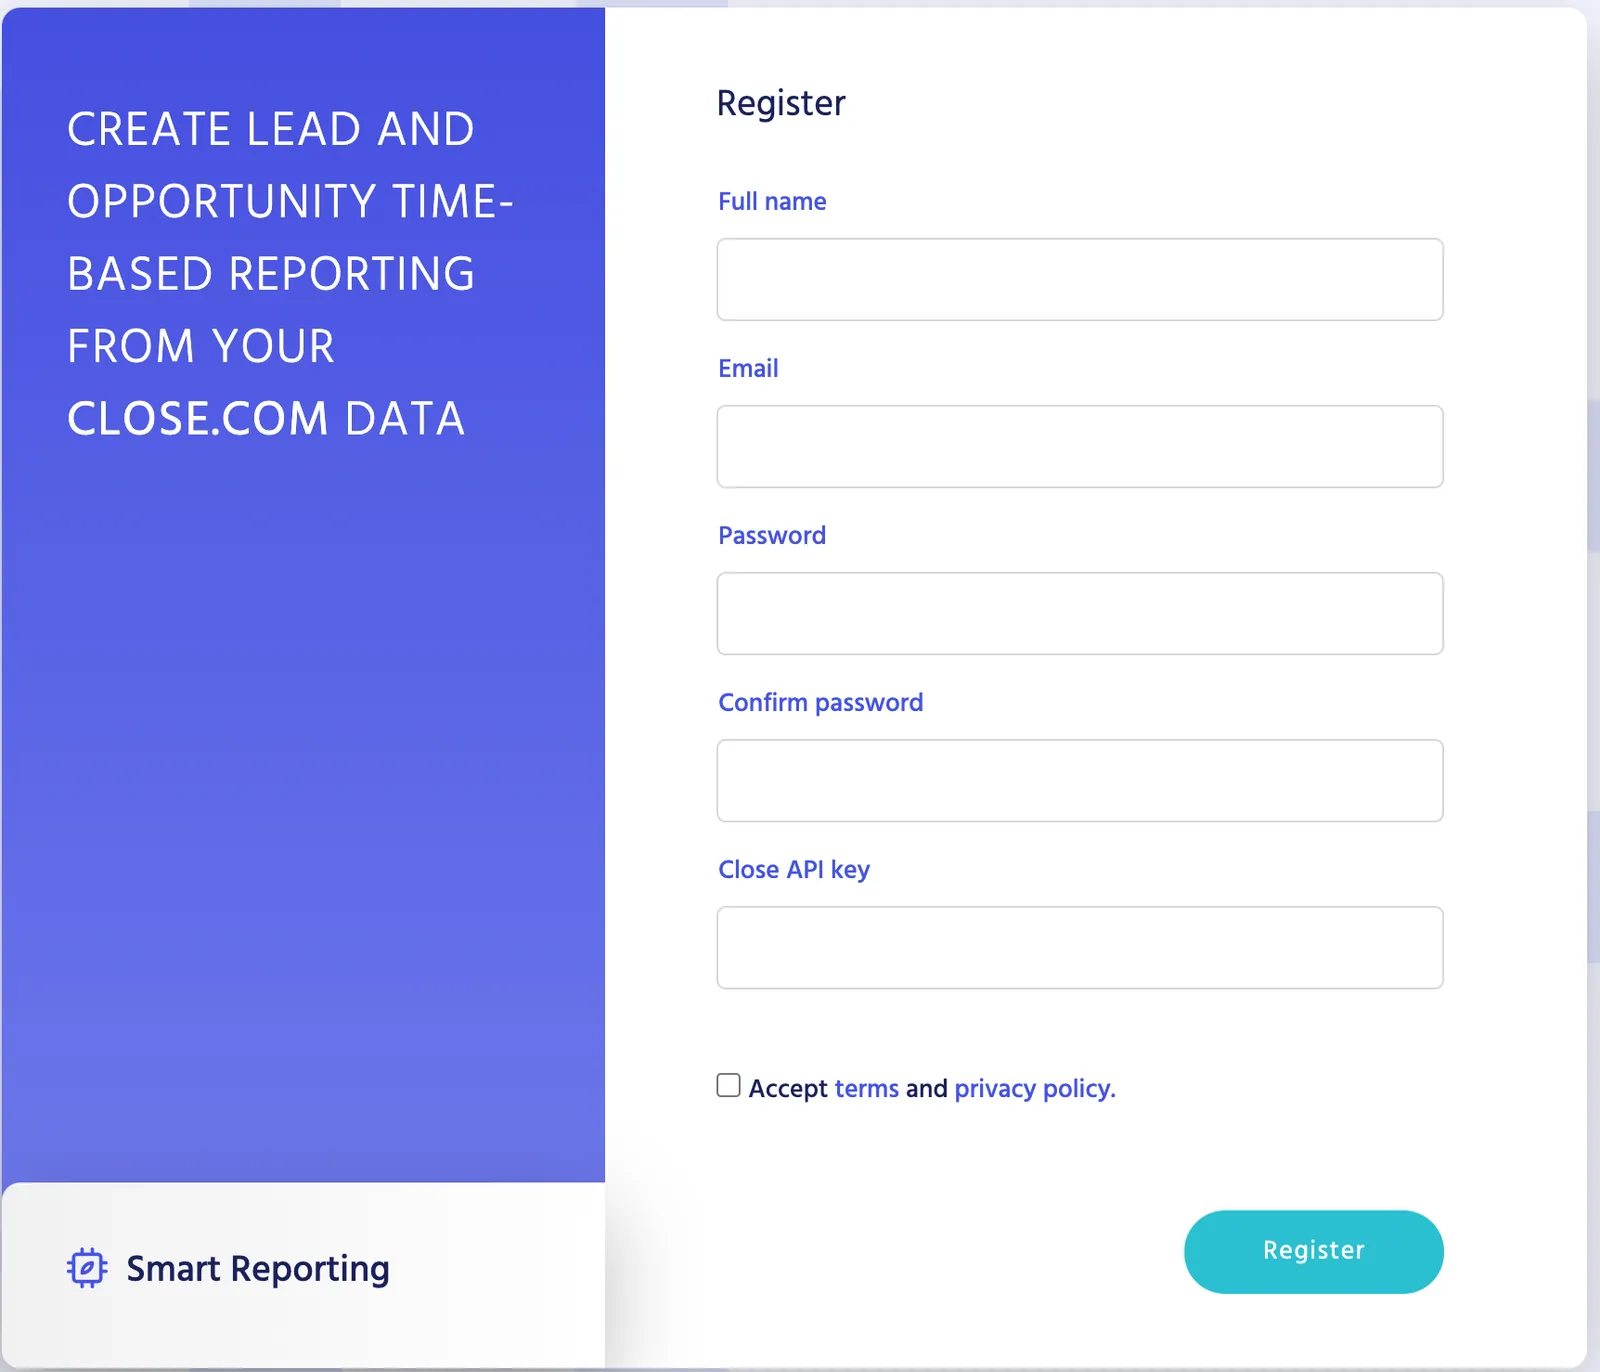
- Start creating metrics and add them to your Dashboard
Dashboard Examples
Let’s say you have the following Opportunity Statuses in your sales pipeline:
- Interested
- Meeting
- Proposal
- Sales
You could set up the following dashboards:
Showing the number of leads per status per month
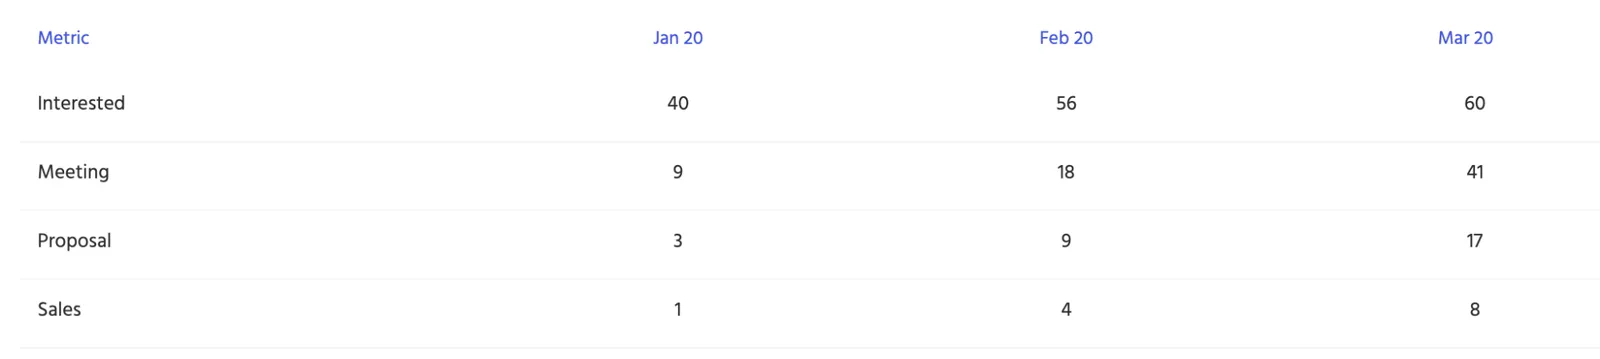
Showing, out of all the interested leads in your pipeline each month, the number of leads who agreed to meet with your team; the number of proposals your team sent; and how many deals your team closed. At the bottom, you can also see conversion rates based on the number of interested leads.
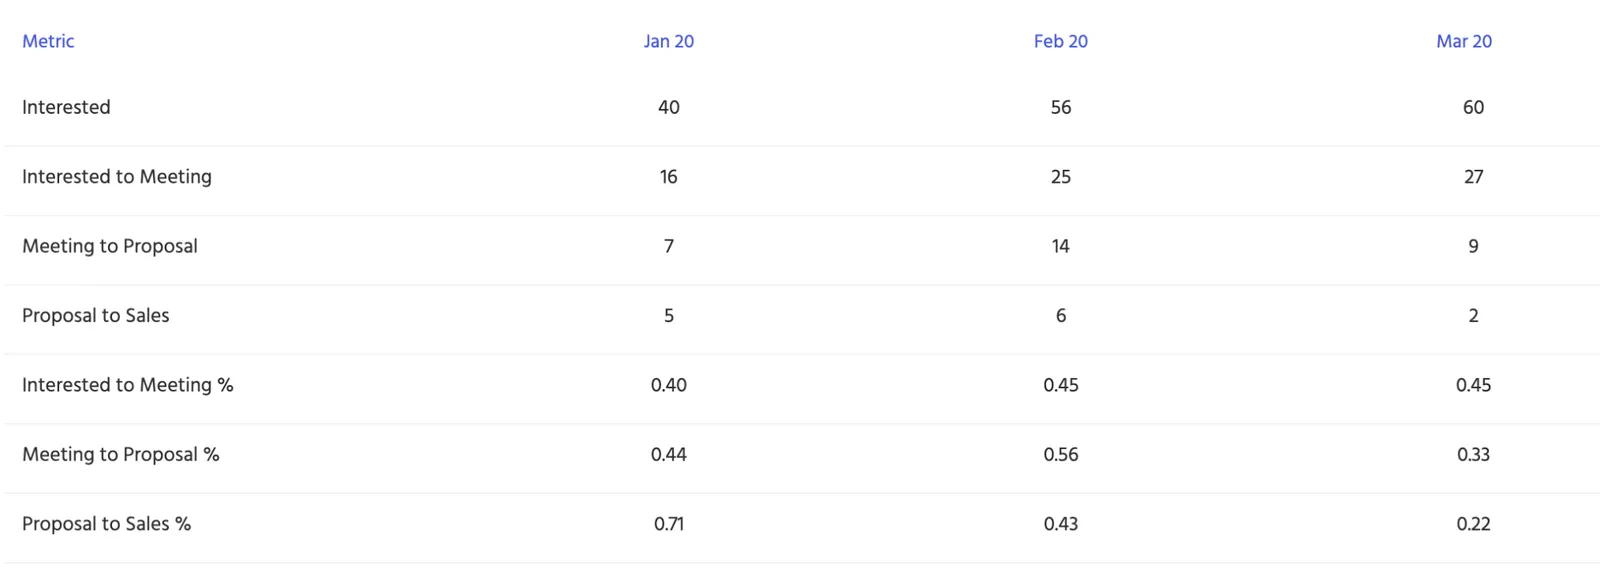
The above dashboards could also display daily, monthly, quarterly, or yearly data, or be divided by rep, lead source, or by any custom field you care about.
Smart Reporting Help Documentation
For more information about Smart Reporting and the integration, please go to their website.