Activity Overview Report
The Activity Overview report shows activity metrics for a specific date range. It’s the first report listed under the Reporting heading on the left sidebar. You can filter and customize the report by Smart View, Users, time frame, and dozens of different activity metrics.
Filtering the report
By Smart View
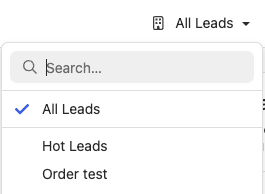
At the top right of the page, you can filter your Activity Overview Report by any of your Smart Views. Browse all of your Smart Views or use the search box at the top to narrow things down.
By user
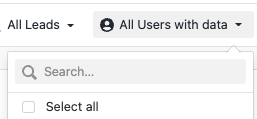
At the top right of the page, you can filter by users. You can select all users, all active users, or all inactive users. You can also use the search bar, or expand the Active and Inactive lists to manually (de)select individual users.
By date range
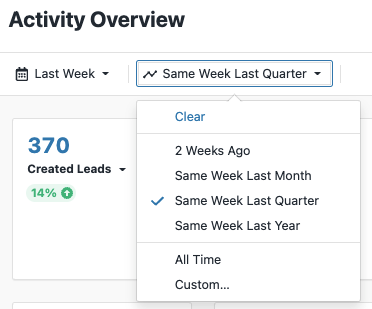
Select the date range for the report at the top left of the page. You can set the report to All Time, limit it to a pre-populated option (like “Today” or “This quarter”), or create a custom date range.
Comparing date ranges
If you’ve selected a date range other than “All Time,” you’ll be able to compare your activity metrics against another date range. Once you select your comparison date range, you’ll see the percentage change for each metric on the activity metric tiles.
Date range comparison adjustment
The comparison date range accounts for number of days in your primary date range. It will adjust the comparison period to contain the same number of days.
For example, if today is the 22nd of the month, and you are viewing “This month” compared to “Last month”, the comparison will automatically be the 1st – 22nd of this month compared with the 1st – 22nd of last month.
Customizing the report
You can customize your report metrics directly on a metric tile, or by using the Reporting Metric button at the top right of the report.
Using the Reporting Metric button
Click the Reporting Metric button in the top right and select the metrics you want in your Activity Overview Report using the checkboxes.
On the tile:
- Hover over the tile and click X to remove the metric.
- Click the dropdown on the tile to change the metric.
- Click and drag the lines at the bottom of the tile to move the metric to a different spot.
- Click on the blue metric number to see all leads that are related to that metric. (e.g. If you click the metric for All Calls, you’ll be taken to a search showing all of the leads those calls are logged on.)
Metric types
Activity metrics separated into five categories. Here are the categories (along with some additional details defining metric terms):
- Leads
- Calls
- Note: “External” calls are manually logged *
- Emails
- SMS
- Opportunities
- Note: “Created for” Opportunities are Opportunities that others team members created for your selected user(s)*
Leaderboard
To display the leaderboard, click the Reporting Metric button in the top right and select “Show Leaderboard.”
When displayed, the leaderboard will appear on the right side of your Activity Overview Report. You can select the metric for your leaderboard using the dropdown at the top of the board.
The leaderboard will always show you 10 leaders (users with the highest values) plus 2 users around your user name if you’re not in the top 10. That means that sometimes you might see ~11-13 users on this list. If you need to see the complete list for a specific metric, consider looking into the Activity Comparison report.
The leaderboard and filters
The leaderboard accounts for all users (even if you have deselected users with the Activity Overview Report’s user filter). However, it will adjust based on your date range, comparison date range, and Smart View filters.
Saving
Once you’ve customized a report, you can save it in order to easily view it later. Saving the report will save any metrics, users, date, and all other filters that you have specified.
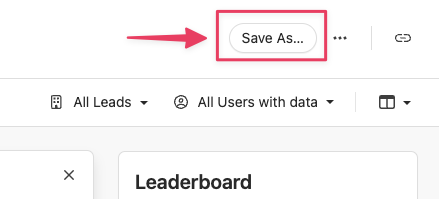
When Saving your report, give it an easy to recall name and choose your sharing options.
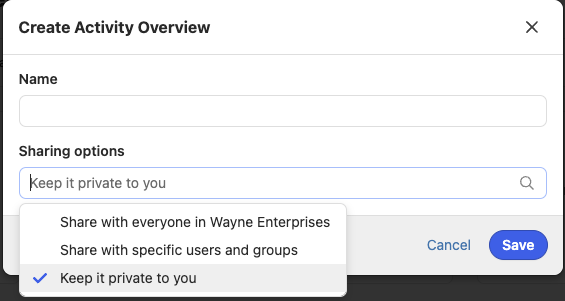
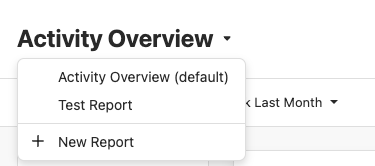
Saved reports appear in the dropdown menu to the right of Activity Overview. Your private saved reports are only visible to you.
Exporting
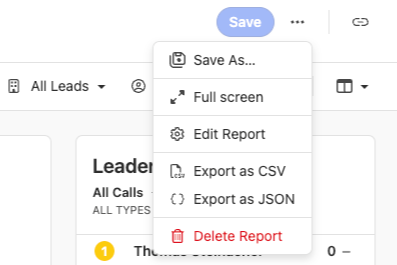
You can export your Activity Overview Report for further analysis. Click the ”…” button at the very top of the page to export as either a CSV or JSON file.
Sharing
You can share a report at any time, whether it is saved or not, by clicking the Copy Link button. The link will share the exact selection of metrics, users, date, and all other filters that are currently displayed.
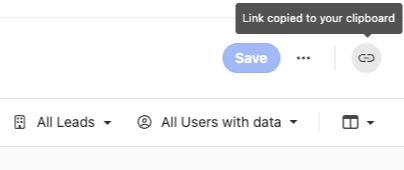
The link will be automatically copied to your clipboard, and can be shared via email, chat, or referenced in a wiki or slide deck.
When sharing a link to a Saved report, any future changes to the saved report will also be reflected in the link that has been shared.