Opportunity Funnels Report
The Opportunity Funnels report helps you keep track of your Opportunities with an in-depth look into how your Opportunities perform over a given time range. This report will show aggregated metrics for the overall performance and specific details about stages in your sales pipeline, along with a visualization that shows how Opportunities progress in that pipeline.
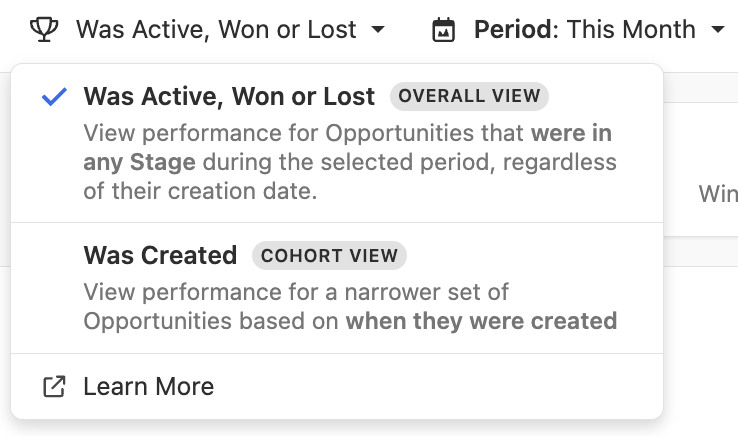
This report has different filtering options to narrow down the type of Opportunity you want to look into, based on the date range you selected. You can view Opportunities that were active during that time period - regardless of when they were created - by selecting Was Active, Won or Lost. If you want to view Opportunities that were created during a specific time period only and were active during another date range, you have the Was Created option. Select a date range of when the Opportunities you want to view were created, along with a date range to view their performance.
Near the top of the graph report, you’ll see a row of different metrics to keep in mind when viewing your dashboard:
- The Number of Opportunities that appear in your results.
- Your Win Rate for those Opportunities. Your Win Rate is calculated by diving the number of won Opportunities by the total Opportunities that were won or lost.
- Average Time it took to close those Opportunities, measured in days (if possible to calculate).
- Average Value per Opportunity win.
- Sales Velocity, which displays how quickly Opportunities move through your Pipeline and generate revenue. This is calculated by # of Opps x avg. Deal size (Win Value) [$] * Avg. Win rate [%] / Avg. Time to Win [days].
Your graph report is separated by Pipeline stages so you can see how your Opportunities move from one status to the next. This will show both Active and Won statuses.
The funnel reporting shows you how many opportunities passed each stage of the pipeline. Summing up each stage won’t give you the total number of opportunities, because each opportunity appears in many stages, therefore it can be counted multiple times in the funnel report. For example, one opportunity went from “Demo Held” to “Sending Poposal”. So it’s counted in both columns. If you take a look at one specific column, it not only includes opportunities which are currently in this status, but also those which moved forward.
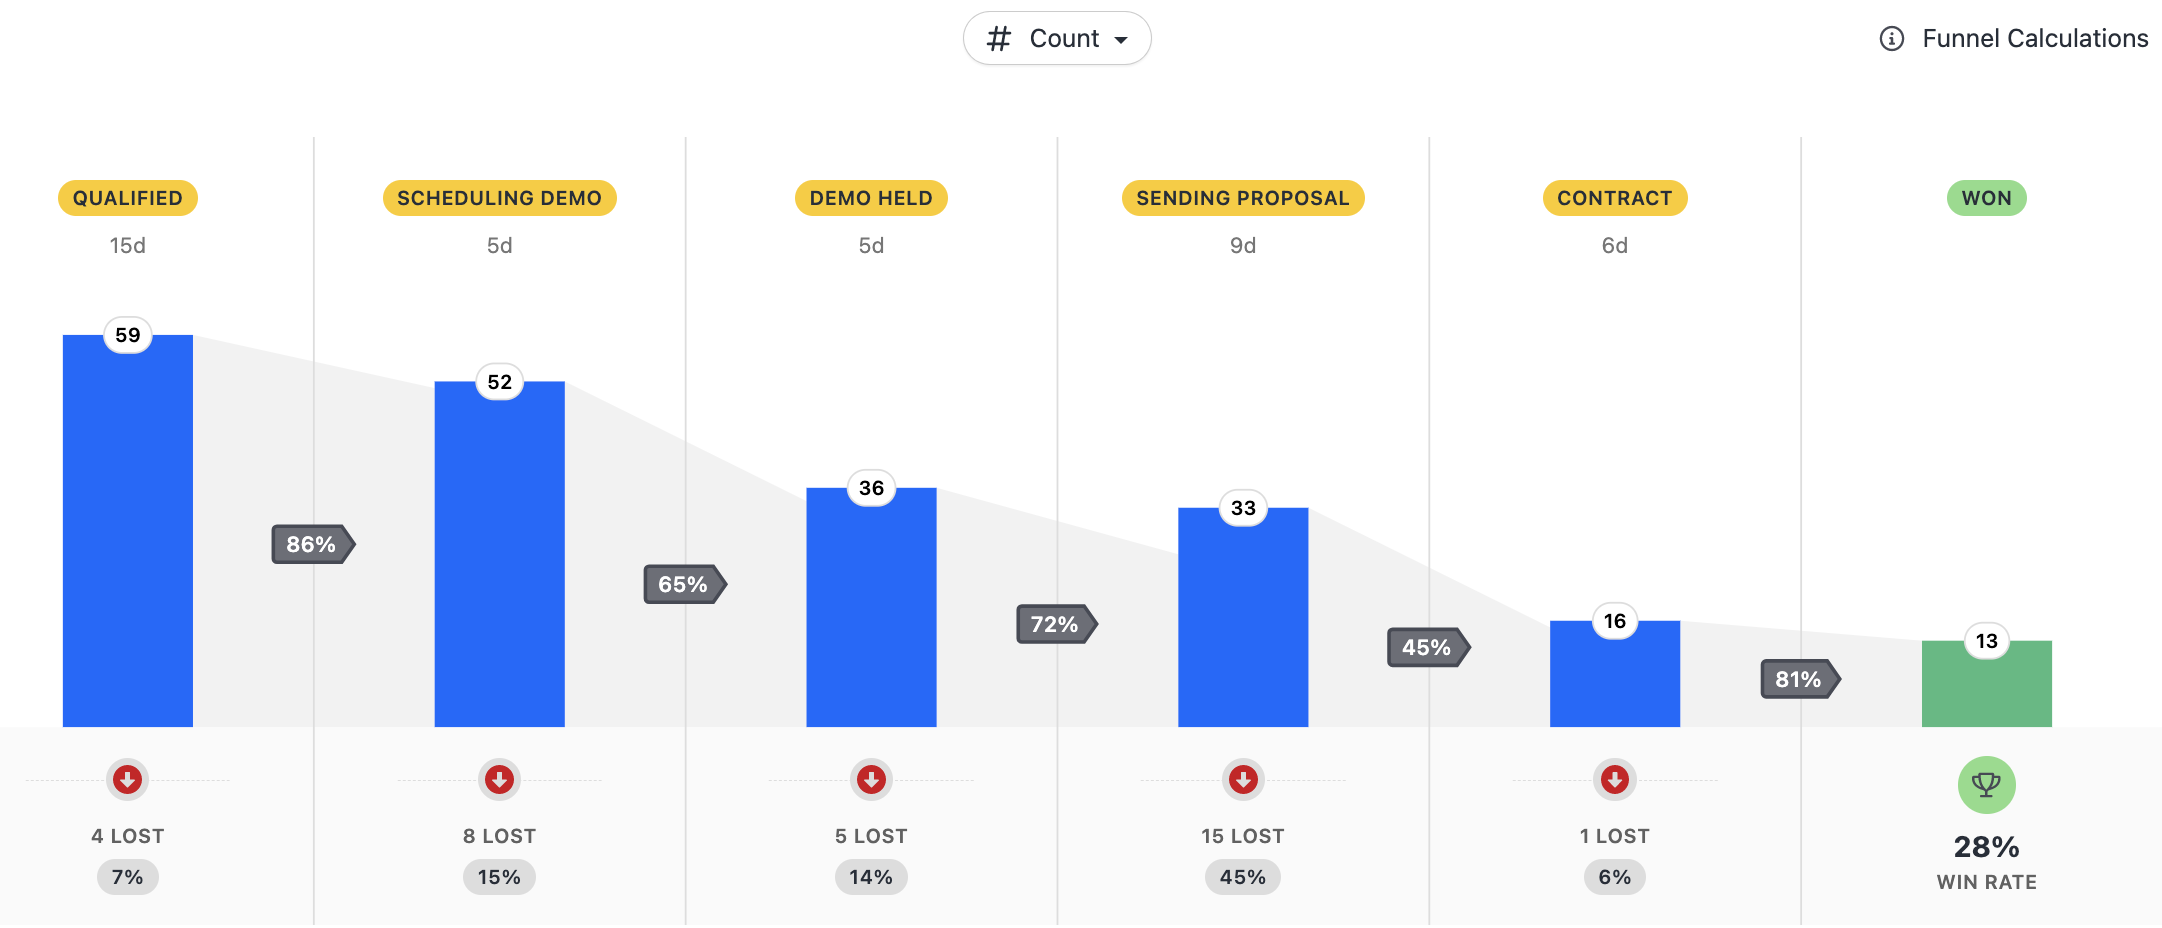
There are 3 different ways to build your report:
- Count: The Number of Opportunities in each Status.
- Value (Annualized): The Annualized Value of your Opportunities.
- Weighted Value (Annualized): The Opportunity Values Annualized, multiplied by their Confidence Percentage.
Keep in mind our Funnel Calculations:
- Skipped Stages: Opportunities that skip Stages are not included in the counts for those skipped Stages.
- Backward Movement: For Opportunities that move backwards in a Pipeline, we will not include any “undone” forward movement in the Funnel.
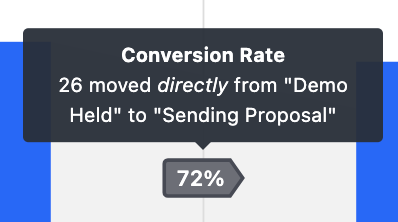
- Conversion Rates: Conversion Rates between Stages only represent Opportunities that converted from the previous Stage directly to the next Stage.
- Avg Time to Advance: The average time an Opportunity spent in a Stage before advancing to any subsequent Stage (does not include any Opportunities that remained in a Stage during the specified Period).
In between each stage, you’ll see the Conversion Rate:
Below this chart is a list of metrics broken down between Opportunity Stages. Your Columns show more nuanced data, like the average time an Opportunity spends in any given stage before advancing to the next stage, and the conversion rate between one Status to the next.
Column Header Explanations
Some Column Headers have a quick explanation for that Column.
Hover over the Column Headers to learn more.
Moving Statuses between Pipelines
If you move an opportunity status from one pipeline to another within your Settings > Statuses & Pipelines page, opportunities with that status won’t be displayed in a report. We are aware of this edge case and will work on an update.